Brick Logger
The Brick Logger can collect sensor data from Bricks and Bricklets and write it to a CSV file for later analysis. Which data from which Bricklet with which interval and with which options should be collected can be configured.
The Brick Logger is part of Brick Viewer since version 2.3.0 and can be opened with the "Data Logger" button. From here it can be configured and executed. There is also a standalone version that can be executed from a terminal.
Configuration
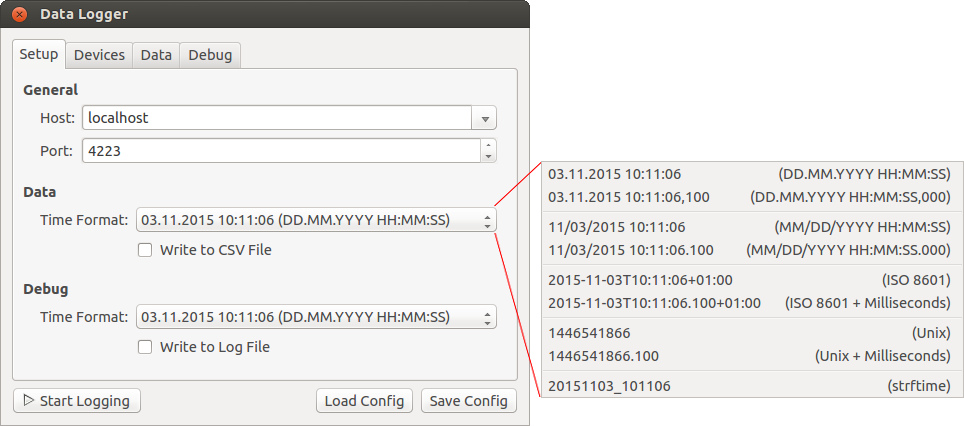
All logged sensor data and debug messages are timestamped. The time format can be configured. The Brick Logger offers different presets:
- DD.MM.YYYY HH:MM:SS is a typical German time format that is automatically recognized by LibreOffice and Microsoft Office.
- DD.MM.YYYY HH:MM:SS,000 is the same German time format but with millisecond resolution.
- MM/DD/YYYY HH:MM:SS is a typical US-English time format that is automatically recognized by LibreOffice and Microsoft Office.
- MM/DD/YYYY HH:MM:SS.000 is the same US-English time format but with millisecond resolution.
- ISO 8601 follows the ISO 8601 standard for representing dates and times.
- ISO 8601 + Milliseconds also follows the ISO 8601 standard but with millisecond resolution.
- Unix counts the number of seconds that have elapsed since 1970-01-01T00:00:00Z.
- Unix + Milliseconds also counts the number of seconds but with millisecond resolution.
- strftime lets you specify your own time format using the Python strftime syntax.
If you are unsure what to choose here then use either DD.MM.YYYY HH:MM:SS or MM/DD/YYYY HH:MM:SS.
By default the sensor data and debug messages are only shown on the "Data" and "Debug" tabs. Those tabs only show the latest 1000 entries. Additionally, the data and messages will also be written to files if the corresponding check boxes are activated.
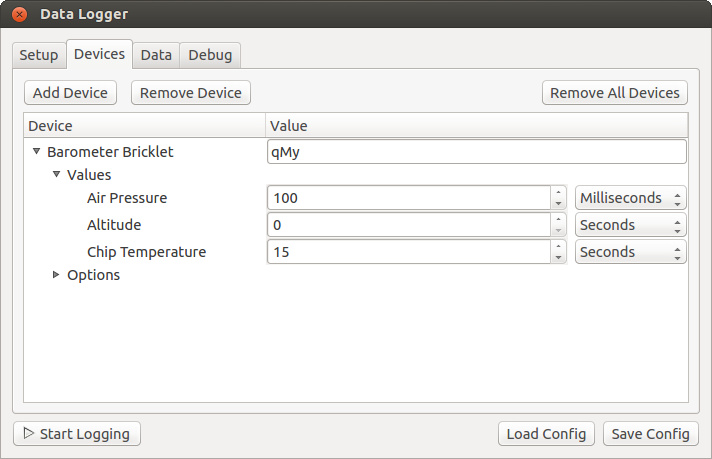
The "Devices" tab allows to configure which sensor data should be collected and how. First, the UID of the Brick or Bricklet has to be configured. The "Add Device" dialog will suggest connected devices including their UID.
Each supported device provides at least one loggable sensor value listed in the "Values" section. By default the interval for each sensor value is set to 0, which means that the value will not be logged. If the interval is set to X seconds or milliseconds (with X larger than 0) then the corresponding sensor value is logged every X seconds or milliseconds. If you configure an interval in milliseconds then also make sure to choose a time format with millisecond resolution on the "Setup" tab.
If the device has options then those are listed in the "Options" section. The Brick Logger automatically takes care of applying the selected options.
Once the configuration is finished the logging process can be started with the "Start Logging" button. The logging process continues until it is stopped with the "Stop Logging" button or by exiting Brick Viewer.
The "Load Config" and "Save Config" buttons can be used to load and save the current configuration.
Standalone
The Brick Logger can also be used outside of Brick Viewer. It is available
as single Python script.
To use it you need to install the Python API bindings and create and save a configuration in Brick Viewer.
Then you can run it like this (config.json is your manually saved
configuration):
python brick-logger.py config.json
RED Brick
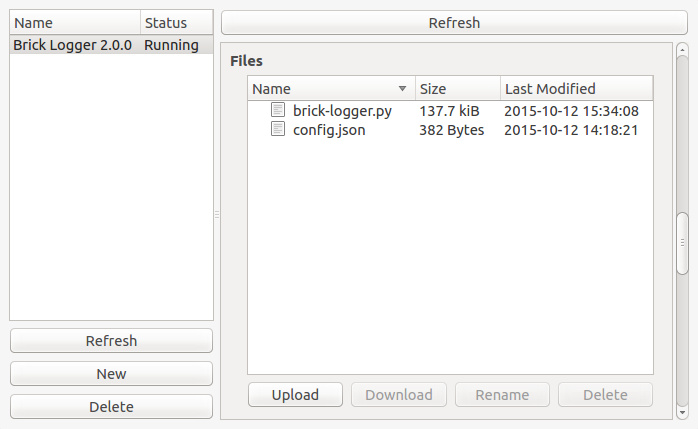
The Brick Logger is also available as preconfigured RED Brick program that you can import. See the RED Brick documentation for details.
After the program got imported the configuration has to be uploaded as
config.json replacing the existing dummy file. Next, the Brick Logger has
to be exited using the "Exit" button in Brick Viewer. The RED Brick will
automatically restart it with the new configuration.