- Getting Started
- Hardware
- Software
- Kits
- Embedded Boards
- Specifications
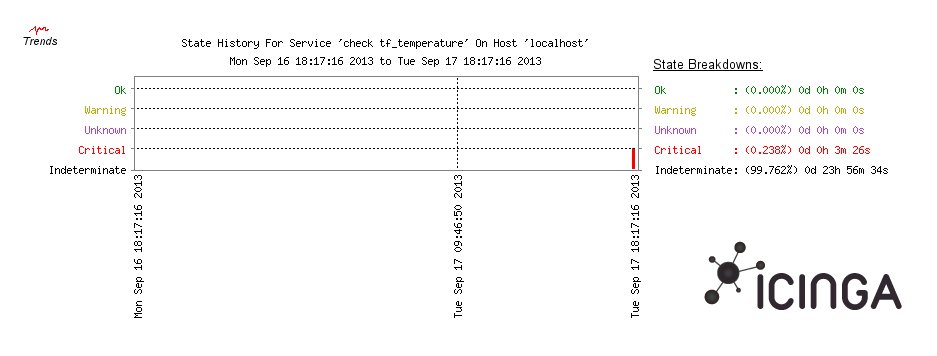
Server Room Monitoring with Nagios or Icinga
Icinga and Nagios are computer system monitoring tools. Icinga is a fork of Nagios and is said to be backward compatible to Nagios. In the following examples we are referring to the Nagios API to be also compatible with Icinga.
Both monitoring tools use plugins, instantiated as services to monitor processor load, memory utilization, software processes or physical values like temperature. Please refer to the respective documentation for more information.
Plugins are used to create monitoring services. Plugins are programs with defined return codes (e.g. 0=OK, 1=Warning, 2=Critical, 3=Unknown). Their standard output is used by Nagios to get information about their state. Please refer to the Nagios Developer Guidelines for more information.
After the basic installation of Nagios you can start with the development of your own plugin. At first install the bindings for your programming language. Next you can start to write your program considering the Nagios Developer Guidelines.
Basic Nagios/Icinga Script
For this example we use the Python bindings. The script (download) uses the a Temperature or PTC Bricklet to measure the temperature and to warn if high temperatures are detected.
The small script, called check_tf_temp.py, uses the following interface:
usage: check_tf_temp.py [-h] -u UID -t {temp,ptc} [-H HOST] [-P PORT]
                        [-m {none,high,low,range}] [-w WARNING] [-c CRITICAL]
                        [-w2 WARNING2] [-c2 CRITICAL2]

optional arguments:
 -h, --help            show this help message and exit
 -u UID, --uid UID     UID from Temperature Bricklet
 -t {temp,ptc}, --type {temp,ptc}
                       Type: temp = Temperature Bricklet, ptc = PTC Bricklet
 -H HOST, --host HOST  Host Server (default=localhost)
 -P PORT, --port PORT  Port (default=4223)
 -m {none,high,low,range}, --modus {none,high,low,range}
                       Modus: none (default, only print temperature), high,
                       low or range
 -w WARNING, --warning WARNING
                       Warning temperature level (temperatures above this
                       level will trigger a warning message in high mode,
                       temperature below this level will trigger a warning
                       message in low mode)
 -c CRITICAL, --critical CRITICAL
                       Critical temperature level (temperatures above this
                       level will trigger a critical message in high mode,
                       temperature below this level will trigger a critical
                       message in low mode)
 -w2 WARNING2, --warning2 WARNING2
                       Warning temperature level (temperatures below this
                       level will trigger a warning message in range mode)
 -c2 CRITICAL2, --critical2 CRITICAL2
                       Critical temperature level (temperatures below this
                       level will trigger a critical message in range mode)
Most of the interface should be self-explanatory. It supports three modes:
high: Message is raised if measured temperature is above WARNING or CRITICALlow: Message is raised if measured temperature is below WARNING or CRITICALrange: Message is raised if measured temperature is above WARNING or CRITICAL or below WARNING2 or CRITICAL2
Make the script globally executable, e.g. store it under /usr/local/bin.
The following example connects to the Ethernet Extension with hostname
ServerMonitoring and to the Temperature Bricklet with UID SCT31. It creates
a warning if the temperature is above 26°C and a critical message if the
temperature is above 27°C:
check_tf_temp.py -H ServerMonitoring -u SCT31 -t temp -m high -w 26 -c 27
The following example creates a warning if the temperature is below 10°C or above 30°C and a critical message if the temperature is below 8°C or above 35°C:
check_tf_temp.py -H ServerMonitoring -u SCT31 -t temp -m range -w 10 -w2 30 -c 8 -c2 35
To use the same function with the PTC Bricklet instead of the Temperature Bricklet we have to change the UID and the type of the Bricklet. The command will then look like this:
check_tf_temp.py -H ServerMonitoring -u fow -t ptc -m range -w 10 -w2 30 -c 8 -c2 35
The check_tf_temp.py script is small and is easy to adapted for other
Tinkerforge sensors. The read method is the main part of the script. It reads
out the Bricklet and compares the measured temperature with
the warning and critical thresholds and generates the necessary message and
return value. The full script looks like this (download):
#!/usr/bin/env python
# -*- coding: utf8 -*-

'''
Based on Wiki project:
http://www.tinkerunity.org/wiki/index.php/EN/Projects/IT_Infrastructure_Monitoring_-_Nagios_Plugin
'''

import sys
import argparse
from tinkerforge.bricklet_ptc import PTC
from tinkerforge.bricklet_ptc_v2 import PTCV2
from tinkerforge.ip_connection import IPConnection
from tinkerforge.bricklet_temperature import Temperature
from tinkerforge.bricklet_temperature_v2 import TemperatureV2

OK = 0
WARNING = 1
CRITICAL = 2
UNKNOWN = 3

TYPE_PTC = 'ptc'
TYPE_TEMPERATURE = 'temp'

class CheckTFTemperature(object):
    def __init__(self, host='localhost', port=4223):
        self.host = host
        self.port = port
        self.ipcon = IPConnection()

    def connect(self, type, uid):
        self.ipcon.connect(self.host, self.port)
        self.connected_type = type

        if self.connected_type == TYPE_PTC:
            ptc = PTC(uid, self.ipcon)

            if ptc.get_identity().device_identifier == PTCV2.DEVICE_IDENTIFIER:
                ptc = PTCV2(uid, self.ipcon)

            self.func = ptc.get_temperature
        elif self.connected_type == TYPE_TEMPERATURE:
            temperature = Temperature(uid, self.ipcon)

            if temperature.get_identity().device_identifier == TemperatureV2.DEVICE_IDENTIFIER:
                temperature = TemperatureV2(uid, self.ipcon)

            self.func = temperature.get_temperature

    def disconnect(self):
        self.ipcon.disconnect()

    def read_temperature(self):
        return self.func()/100.0

    def read(self, warning, critical, mode='none', warning2=0, critical2=0):
        temp = self.read_temperature()

        if mode == 'none':
            print "temperature %s °C" % temp
        else:
            if mode == 'low':
                warning2 = warning
                critical2 = critical

            if temp >= critical and (mode == 'high' or mode == 'range'):
                print "CRITICAL : temperature too high %s °C" % temp
                return CRITICAL
            elif temp >= warning and (mode == 'high' or mode == 'range'):
                print "WARNING : temperature is high %s °C" % temp
                return WARNING
            elif temp <= critical2 and (mode == 'low' or mode == 'range'):
                print "CRITICAL : temperature too low %s °C" % temp
                return CRITICAL
            elif temp <= warning2 and (mode == 'low' or mode == 'range'):
                print "WARNING : temperature is low %s °C" % temp
                return WARNING
            elif (temp < warning and mode == 'high') or \
                 (temp > warning2 and mode == 'low') or \
                 (temp < warning and temp > warning2 and mode == 'range'):
                print "OK : %s°C " % temp
                return OK
            else:
                print "UNKNOWN : can't read temperature"
                return UNKNOWN

if __name__ == '__main__':
    parse = argparse.ArgumentParser()
    parse.add_argument(
        '-u',
        '--uid',
        help = 'UID from Temperature Bricklet', required=True)
    parse.add_argument(
        '-t',
        '--type',
        help = 'Type: temp = Temperature Bricklet, ptc = PTC Bricklet',
        type = str,
        choices = [TYPE_TEMPERATURE, TYPE_PTC],
        required = True)
    parse.add_argument(
        '-H',
        '--host',
        help = 'Host Server (default=localhost)',
        default = 'localhost')
    parse.add_argument(
        '-P',
        '--port',
        help = 'Port (default=4223)',
        type = int,
        default = 4223)
    parse.add_argument(
        '-m',
        '--modus',
        help = 'Modus: none (default, only print temperature), high, low or range',
        type = str,
        choices = ['none', 'high','low','range'],
        default = 'none')
    parse.add_argument(
        '-w',
        '--warning',
        help = 'Warning temperature level (temperatures above this level will trigger a warning message in high mode, temperature below this level will trigger a warning message in low mode)',
        required = False,
        type = float)
    parse.add_argument(
        '-c',
        '--critical',
        help = 'Critical temperature level (temperatures above this level will trigger a critical message in high mode, temperature below this level will trigger a critical message in low mode)',
        required = False,
        type = float)
    parse.add_argument(
        '-w2',
        '--warning2',
        help = 'Warning temperature level (temperatures below this level will trigger a warning message in range mode)',
        type = float)
    parse.add_argument(
        '-c2',
        '--critical2',
        help = 'Critical temperature level (temperatures below this level will trigger a critical message in range mode)',
        type = float)

    args = parse.parse_args()

    tf = CheckTFTemperature(args.host, args.port)
    tf.connect(args.type, args.uid)

    exit_code = tf.read(
                    args.warning,
                    args.critical,
                    args.modus,
                    args.warning2,
                    args.critical2)

    tf.disconnect()

    sys.exit(exit_code)
To run this script with Nagios you have to register it. To do this you have
to register the command with the following lines in a commands config file
(e.g. /usr/local/nagios/etc/checkcommands.cfg or /etc/icinga/commands.cfg):
define command {
    command_name    check_tf_temp
    command_line    /usr/local/bin/check_tf_temp.py -H ServerMonitoring -u SCT31 -t temp -m high -w 26 -c 27
}
After the command is known to Nagios it can be used by a service. To register a new service you can add the following lines to a service config file:
define service {
    use                             generic-service
    host_name                       localhost
    service_description             Check Temperature
    check_command                   check_tf_temp
    check_interval                  1
}
Possible config file locations are /usr/local/nagios/etc/services.cfg
/etc/icinga/objects/services_icinga.cfg or other. The respective documentation
should give more information.
That's it. You should see a new service in the web interface and should be warned if the ambient temperature is too hot.