- Getting Started
- Hardware
- Software
- Kits
- Starter Kit: Weather Station
- Starter Kit: Hardware Hacking
- Starter Kit: Server Room Monitoring
- Starter Kit: Server Room Monitoring 2.0
- Starter Kit: Blinkenlights
- Starter Kit: Internet of Things
- Starter Kit: Camera Slider
- Tabletop Weather Station
- Embedded Boards
- Specifications
Starter Kit: Server Room Monitoring


Note
The Starter Kit: Server Room Monitoring is discontinued and is no longer sold. The Starter Kit: Server Room Monitoring 2.0 is the recommended replacement.
Features
Low Cost and Modular Server Room Monitoring (19" Rack, 1U)
Expandable: Simply add extra Sensors and I/O modules as needed
Powered over Ethernet (PoE) or USB
Configuration of customized solution without programming possible
For Programmers: API for many programming languages:
Open Source Soft- and Hardware with Nagios and Icinga support
Description
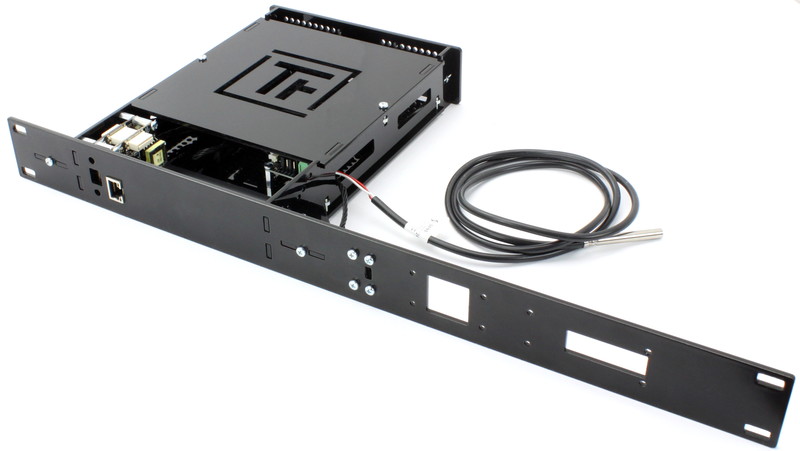
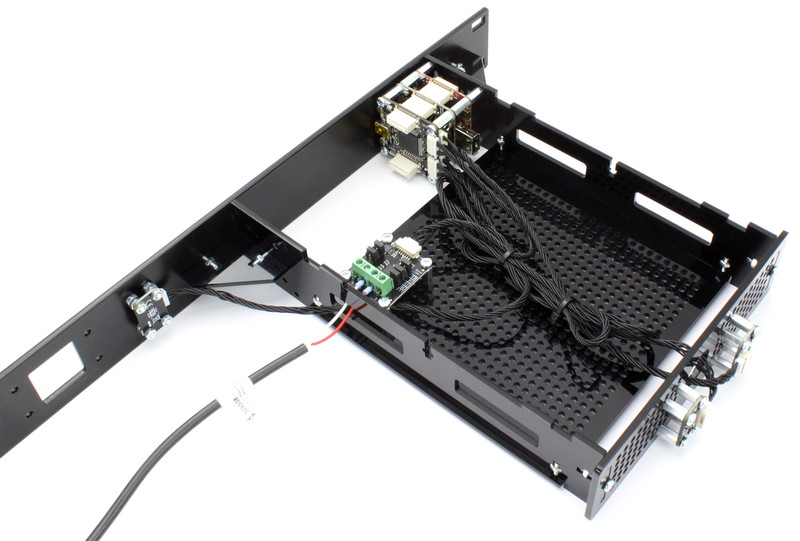
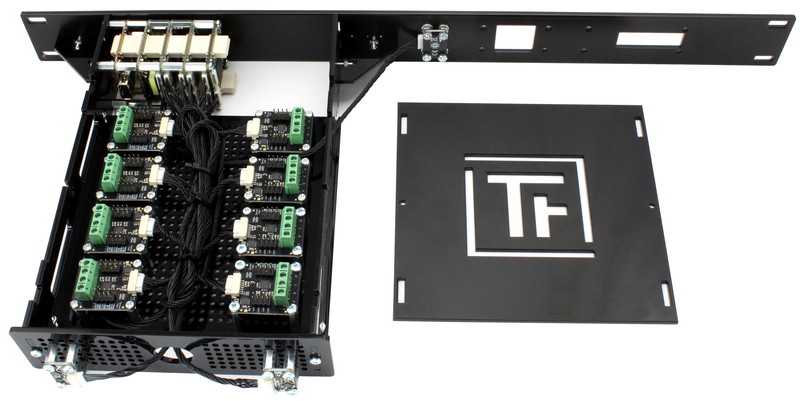
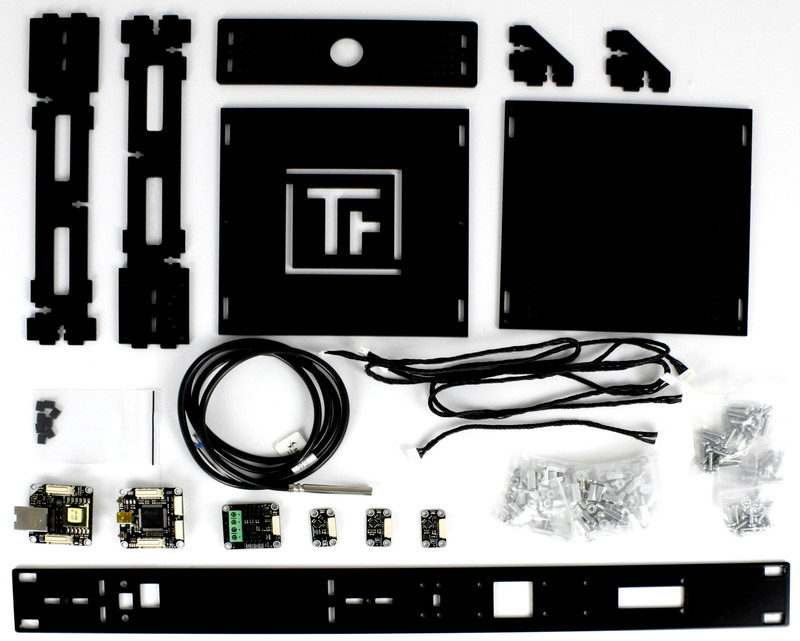
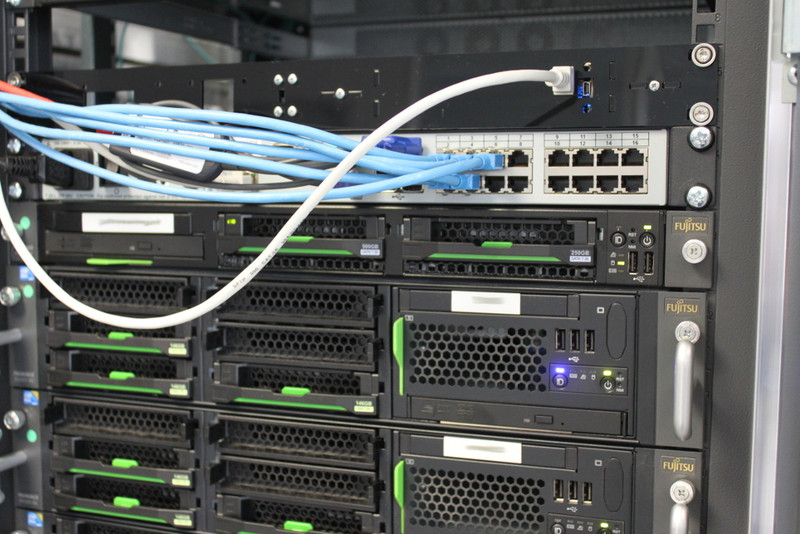
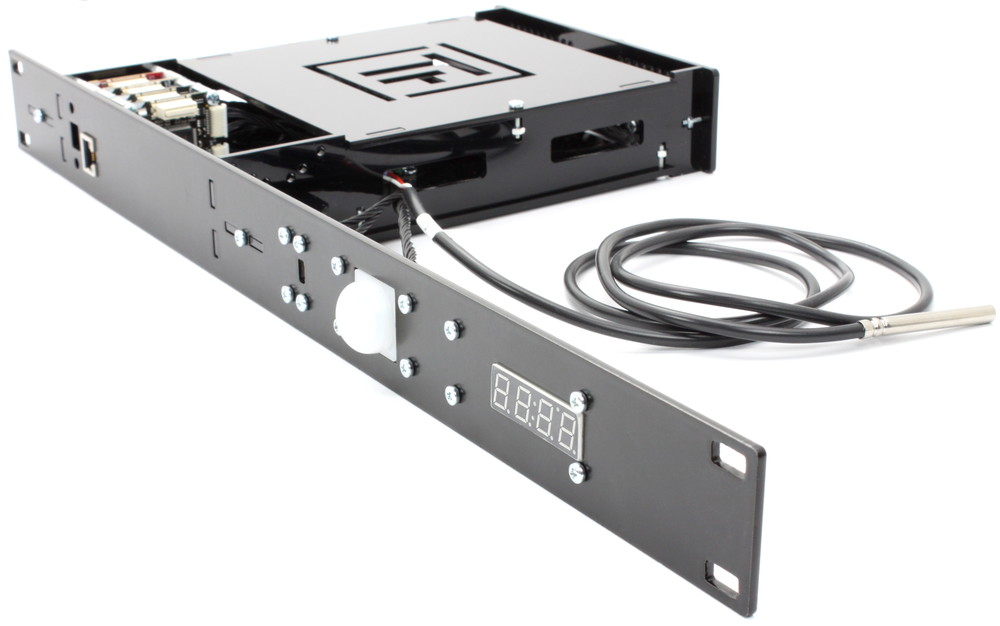
The Starter Kit: Server Room Monitoring is an open source kit that can monitor server room installations. The basic kit is equipped with the following Sensors: Ambient Light Bricklet 3.0 (monitors room illumination), Humidity Bricklet 2.0 (monitors humidity), Temperature Bricklet 2.0 (monitors temperature in the server rack) and a PTC Bricklet 2.0 with attachable Pt100 temperature sensor probe (monitors temperature in a server). Place for up to eight PTC Bricklets with up to eight temperature sensors is provided.
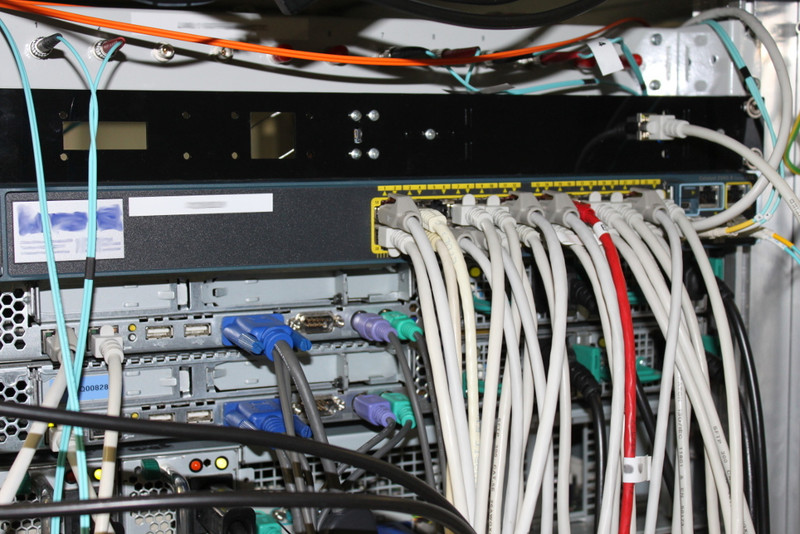
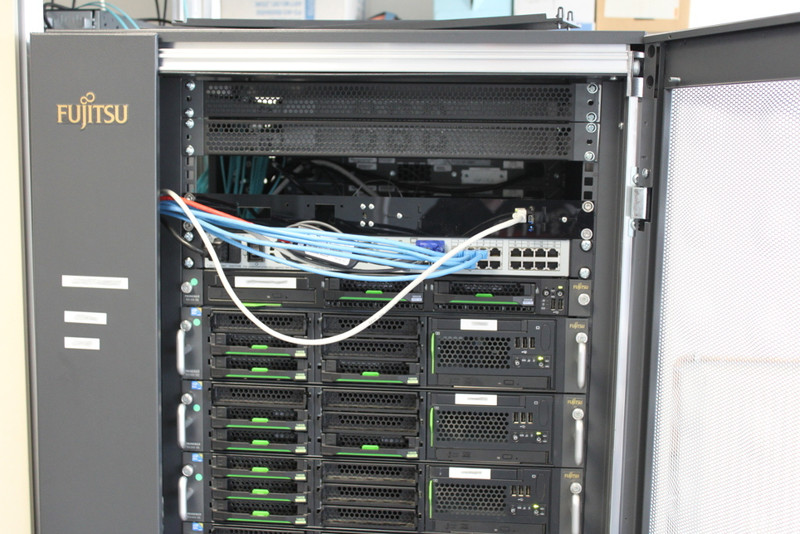
The kits enclosure can be mounted directly in a 19" server rack and can be extended by other Tinkerforge building blocks, e.g. more temperature probes, motion detector, in- or outputs (to switch computers on/off or to monitor doors), to flexibly adapt the kit to your needs.
Two different applications are possible:
Non-stand-alone monitoring (standard kit)
The sensors of the kit are read out via Ethernet or USB by a computer with the offered APIs (C/C++, C/C++ for Microcontrollers, C#, Delphi/Lazarus, Go, Java, JavaScript, LabVIEW, Mathematica, MATLAB/Octave, MQTT, openHAB, Perl, PHP, Python, Ruby, Rust, Shell, Visual Basic .NET). Individual solutions can be realized with ease. Examples for Bash and Nagios/Icinga demonstrate different possibilities.
Stand-alone monitoring (standard kit + RED Brick)
With an additional RED Brick external control by another computer is not necessary anymore. You can configure your own monitoring solution using just Brick Viewer without any programming.
The value range for each sensor can be defined with sliders. It is possible to enable email notifications for monitoring values that are out of range. Rules can be defined for sensors that are directly connected, but also for other Tinkerforge sensors available in the network. The defined rules configure an instance of Nagios that runs on the RED Brick. The Nagios web interface shows current monitoring values and currently existing problems. More information can be found in the RED Brick section of the Server Room Monitoring documentation.
Advanced users can easily modify the Nagios installation that runs on the RED Brick to change configurations that go beyond the Brick Viewer possibilities.
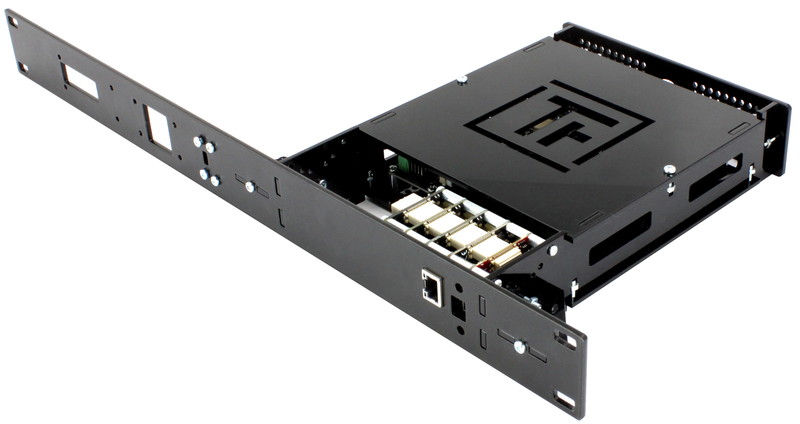
The kit can be powered through Power over Ethernet (PoE) or USB.
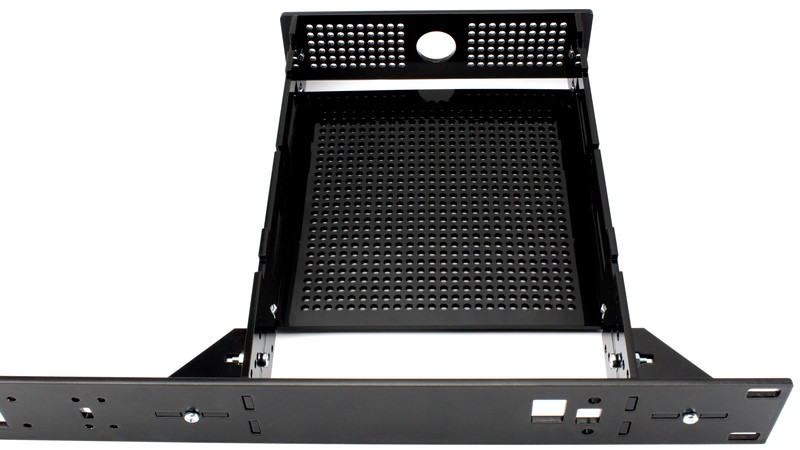
The soft- and hardware of the kit can be modified. The casing, except of the powder coated aluminum front panel, consists of tinker-friendly PMMA, you can drill new holes with a wood drill. Mounting holes for different Bricks and Bricklets are provided.
You can mount a Motion Detector Bricklet 2.0, a Segment Display 4x7 Bricklet 2.0 and a E-Paper 296x128 Bricklet in the front panel.
Technical Specifications
Property |
Value |
|---|---|
Illumination |
0lux - 64000lux in 0.01lux steps |
Ambient Temperature |
-40°C - 85°C in 0.01°C steps |
Pt100 Sensor Probe |
-20°C - 450°C |
PTC Bricklet 2.0 |
0.03125°C (15bit) resolution |
Humidity Bricklet 2.0 |
0% - 100% relative humidity |
Dimensions (W x D x H) |
482 x 92 x 44mm (19.0 x 3.62 x 1.75") |
Weight |
250g |
Resources
Example Source Code for Simple Monitoring (Download: Shell)
Example Source Code for Nagios/Icinga Plugin (Download: Python)
Example Source Code for Nagios/Icinga Extended Plugin (Download: Python)
First tests, firmware upgrade and configuration
As a very first step you should try out and update your Bricks and Bricklets.
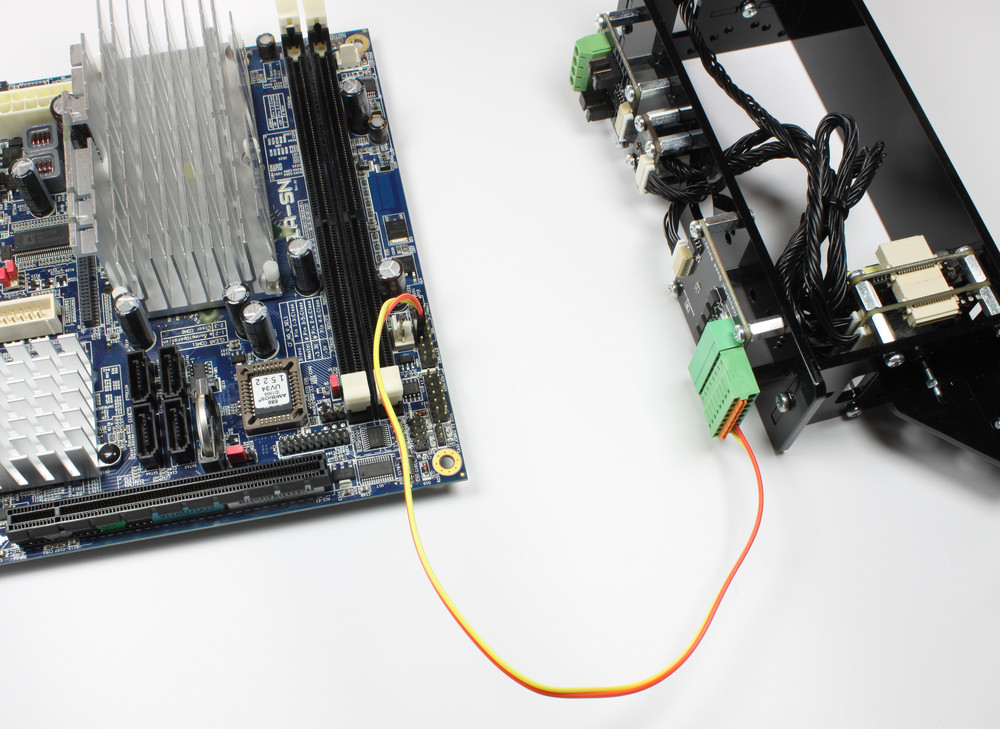
For that you need to install the Brick Daemon and the Brick Viewer. At next you should configure the PTC Bricklet 2.0 and attach the temperature probe (2-wire). documented here and here.
After this put the Ethernet Extension on top of the Master Brick, connect all Bricklets to it and connect it via USB to your PC. Afterwards use Brick Viewer to check if all firmwares are up to date (Updates / Flashing button). If not, you can update the Bricks and update the Bricklets with the Brick Viewer, too:
As next step click through the tabs of the Brick Viewer to see if everything is working correctly. Next you should configure the Ethernet Master Extension. In our further examples we configure the hostname to "ServerMonitoring" and use DHCP. To do that click on the Master Brick tab and configure it to your needs. More information about the configuration of the Ethernet Extension can be found here.
After testing the hardware and configuration you can be sure that the Bricks and Bricklets have versions that work together and that everything will work if it is screwed together in the 19" server enclosure.
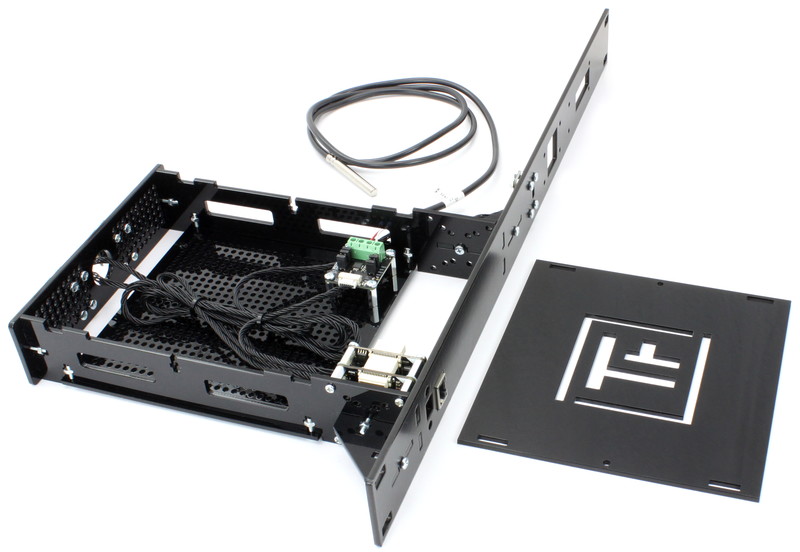
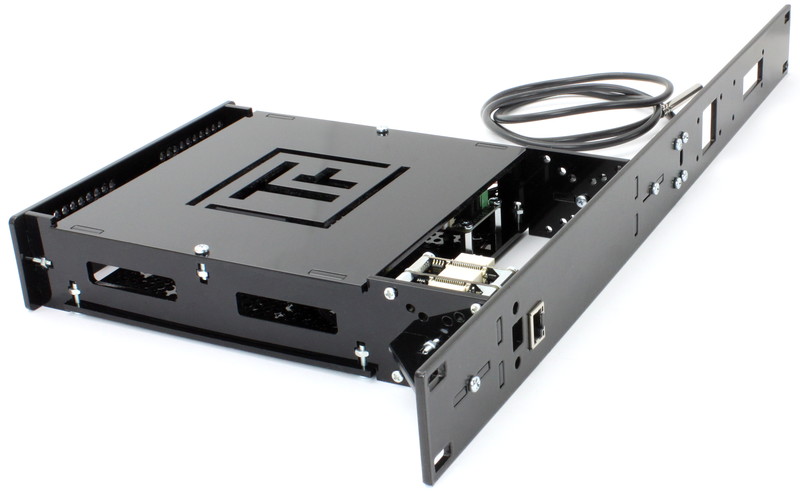
Construction
The construction of the basic kit is described here.
RED Brick
If the kit is used together with a RED Brick then Nagios running on the RED Brick can be configured directly using Brick Viewer.
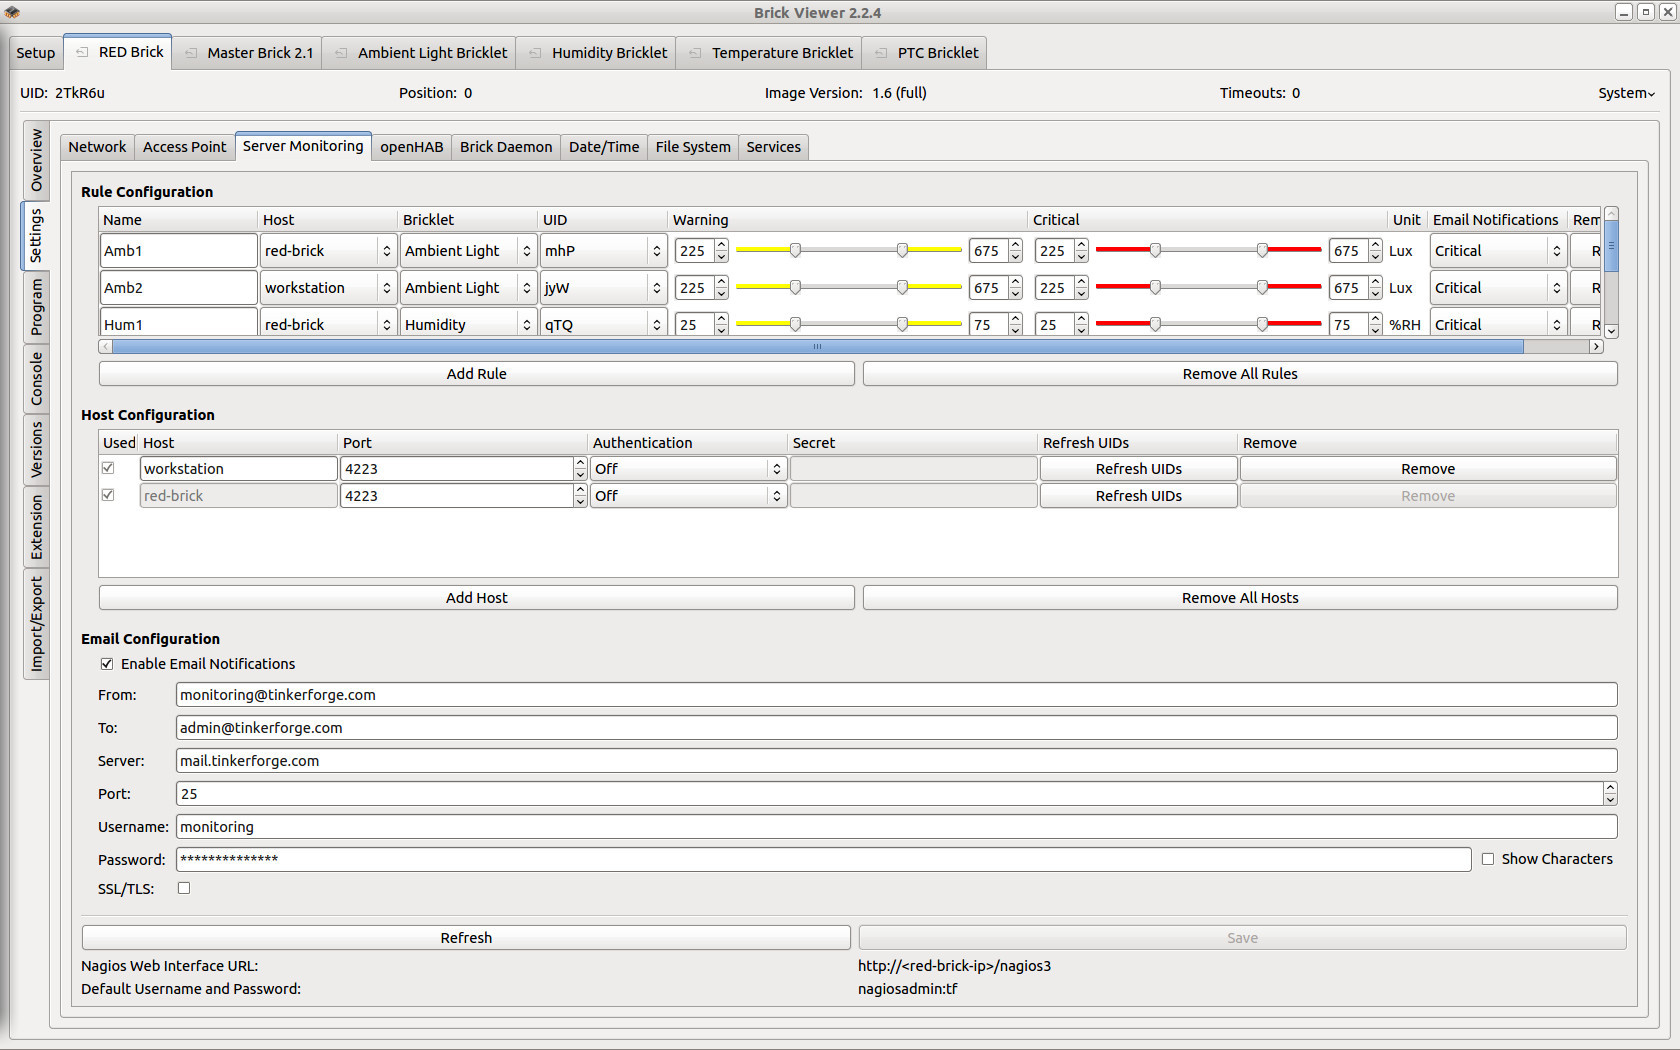
To enable the Server Monitoring service (requires RED Brick Image >= 1.6 and Brick Viewer >= 2.2.3) go to the services tab and tick the Server Monitoring checkbox.
If the Server Monitoring service is enabled, it is possible to add rules. A rule basically consists of the Bricklet type (Temperature, Ambient Light, Humidity or PTC), its UID and a warning as well as a critical range. Just add as many rules as you need and configure them as required.
You can also configure automatic email notification for each of the
warning/critical ranges. Just tick the Enable Email Notification checkbox
and add the required information.
Click Save to save the configuration on the RED Brick. You can now visit
http://<red-brick-ip>/nagios/ or http://<red-brick-ip>/nagios3/ (RED Brick image version 1.19 and older)
to view the current Nagios status.
The default username:password is nagiosadmin:tf. You can change the
password through the console with:
sudo htpasswd -c -b /usr/local/nagios/etc/htpasswd.users nagiosadmin <PASSWORD>
For RED Brick image version 1.9 and older:
sudo htpasswd -c -b /etc/nagios3/htpasswd.users nagiosadmin <PASSWORD>
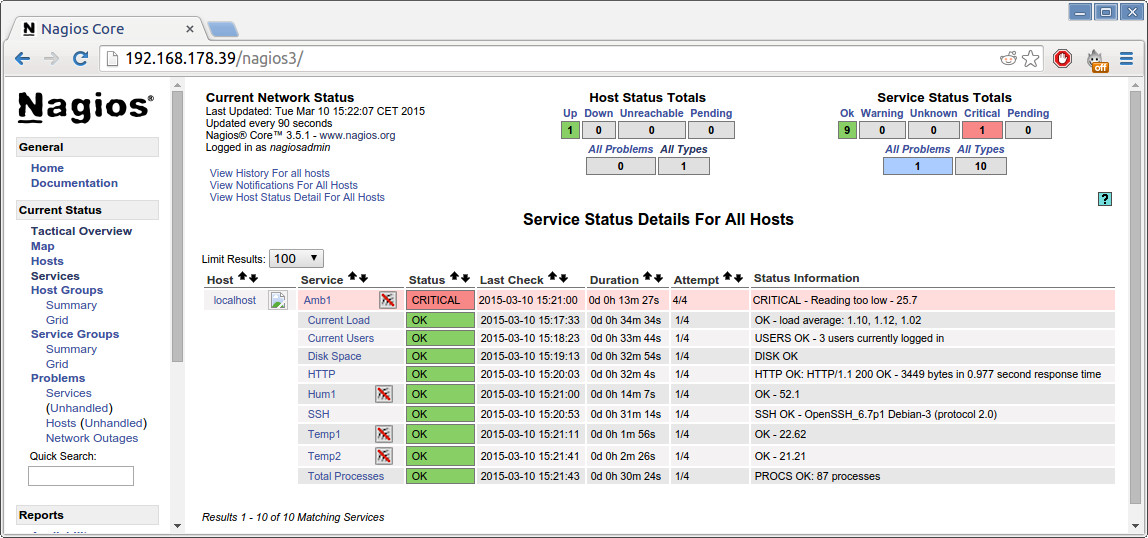
Each of the rules will be shown as a service in Nagios. An overview over all
services is available if you click on Services in the Current Status
category.
Projects
There are several applications for the Starter Kit: Server Room Monitoring. In the following we are showing some examples which can act as a starting point for your own projects.
Simple Monitoring
In this example we use the Shell Bindings to read out the different sensors in the kit.
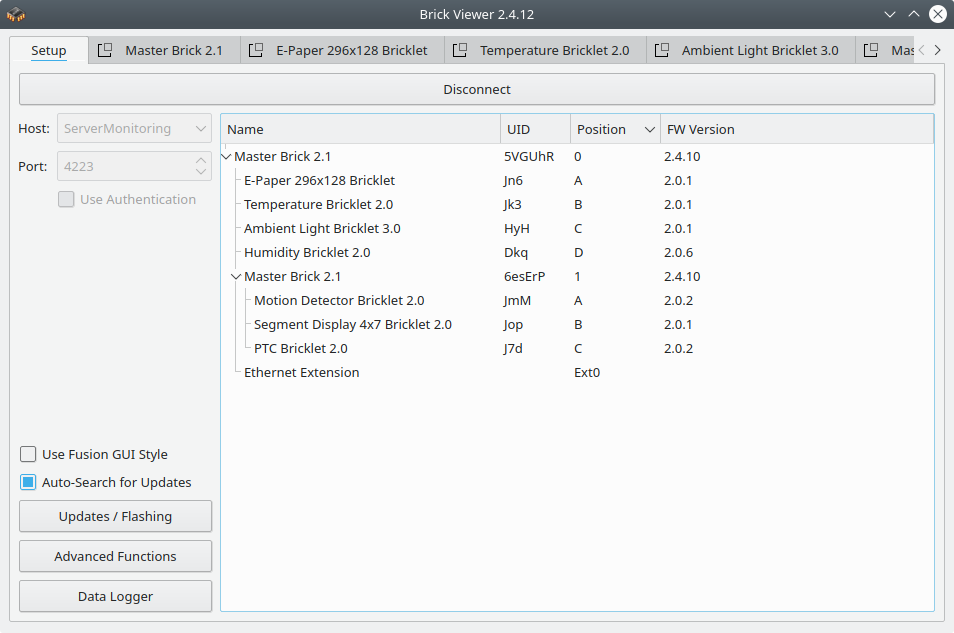
Enumerate the Bricks and Bricklets ("is all connected?"):
$ tinkerforge --host ServerMonitoring enumerate
uid=5VGUhR
connected-uid=0
position=0
hardware-version=2,1,0
firmware-version=2,4,10
device-identifier=master-brick
enumeration-type=available

uid=Jn6
connected-uid=5VGUhR
position=a
hardware-version=1,0,0
firmware-version=2,0,1
device-identifier=e-paper-296x128-bricklet
enumeration-type=available

uid=Jk3
connected-uid=5VGUhR
position=b
hardware-version=1,0,0
firmware-version=2,0,1
device-identifier=temperature-v2-bricklet
enumeration-type=available

uid=HyH
connected-uid=5VGUhR
position=c
hardware-version=1,0,0
firmware-version=2,0,1
device-identifier=ambient-light-v3-bricklet
enumeration-type=available

uid=Dkq
connected-uid=5VGUhR
position=d
hardware-version=1,0,0
firmware-version=2,0,6
device-identifier=humidity-v2-bricklet
enumeration-type=available

uid=6esErP
connected-uid=5VGUhR
position=1
hardware-version=2,1,0
firmware-version=2,4,10
device-identifier=master-brick
enumeration-type=available

uid=JmM
connected-uid=6esErP
position=a
hardware-version=1,0,0
firmware-version=2,0,2
device-identifier=motion-detector-v2-bricklet
enumeration-type=available

uid=Jop
connected-uid=6esErP
position=b
hardware-version=1,0,0
firmware-version=2,0,1
device-identifier=segment-display-4x7-v2-bricklet
enumeration-type=available

uid=J7d
connected-uid=6esErP
position=c
hardware-version=1,0,0
firmware-version=2,0,2
device-identifier=ptc-v2-bricklet
enumeration-type=available
Read out connected sensors (adapt the UID):
$ tinkerforge --host ServerMonitoring call temperature-bricklet SCT31 get-temperature
temperature=2487

$ tinkerforge --host ServerMonitoring call ambient-light-v2-bricklet ajC get-illuminance
illuminance=410

$ tinkerforge --host ServerMonitoring call ptc-bricklet fow get-temperature
temperature=2603
The shell bindings support the execution of additional shell commands with the
--execute option (see Shell Bindings for more
information). The following script shows how to convert the returned value into
degree Celsius and how to save it in a variable for further use.
#!/bin/sh

HOST=ServerMonitoring
TEMP_UID=Jk3

temp=$(tinkerforge --host $HOST call temperature-v2-bricklet $TEMP_UID get-temperature\
       --execute "echo '{temperature} / 100' | bc -l | xargs printf '%.2f\n'")
echo $temp
The next script shows how to show text on the E-Paper 296x128 Bricklet
code-block:: bash
#!/bin/sh
HOST=ServerMonitoring E_PAPER_UID=Jn6
tinkerforge --host $HOST call e-paper-296x128-bricklet $E_PAPER_UID fill-display 1 tinkerforge --host $HOST call e-paper-296x128-bricklet $E_PAPER_UID draw-text 0 0 4 2 0 $1 tinkerforge --host $HOST call e-paper-296x128-bricklet $E_PAPER_UID draw
Using the last script (saved as print_e_paper.sh) with the following will print the current temperature on the E-Paper Bricklet.
#!/bin/sh

HOST=ServerMonitoring
TEMP_UID=Jk3

temp=$(./tinkerforge_shell --host $HOST call temperature-v2-bricklet $TEMP_UID get-temperature\
       --execute "echo '{temperature} / 100' | bc -l | xargs printf '%.2f\n'")
./print_e_paper.sh "Temperature:$temp\xF8C"
Server Room Monitoring with Nagios or Icinga
Note
A ready-to-use Icinga Check Plugin that is maintained by Netways can be found on the icinga exchange: https://exchange.icinga.com/netways/check_tinkerforge
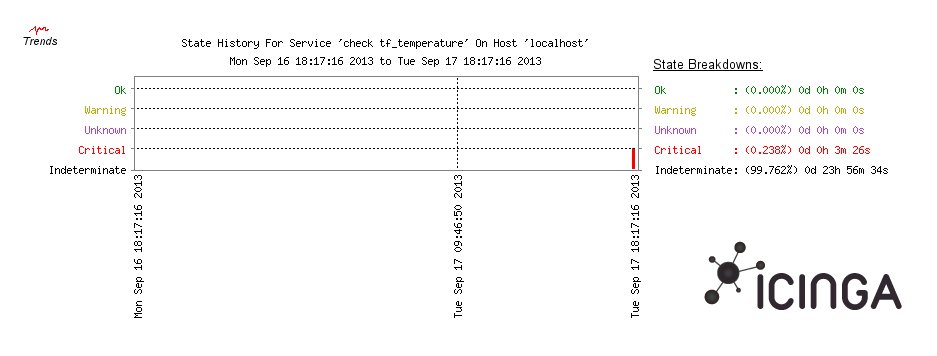
Icinga and Nagios are computer system monitoring tools. Icinga is a fork of Nagios and is said to be backward compatible to Nagios. In the following examples we are referring to the Nagios API to be also compatible with Icinga.
These monitoring tools use plugins, instantiated as services to monitor processor load, memory utilization, specific software processes or physical values like temperature.
In this example we write our own plugin to use the kits hardware for ambient temperature measuring. With a few modifications you can use the plugin to support other Tinkerforge hardware modules and create the physical monitoring you need.
Find the full project description here.
The section about further enhancements lists more Nagios/Icinga examples.
Further Enhancements
If you have modded, extended or improved the kit in any way and you have published your results on our forum, on your blog or similar: Please give us a notice. We would love to add a link to your project here!
Motion Detector and Error Code Display
The casing has already the necessary cut-outs for a Motion Detector Bricklet 2.0 and a Segment Display 4x7 Bricklet. Use a Motion Detector Bricklet to detect motion in your server room. An additional Segment Display 4x7 Bricklet can be used to show error code information on the case.
The full project description can be found here.
Remote On/Off Switch
Use Industrial Quad Relay to switch computers on or off remotely. You can use the previous examples to modify them to your needs. The wiring is really simple, you only have to bypass the on/off switch of the computer with one of the relays of the Industrial Quad Relay Bricklet. A tutorial how a switch can be bypassed can be found at the Hardware Hacking for Beginners Tutorial.
Monitoring Server Rack Door with Distance IR Bricklet
Martin Seener developed a check for Nagios that uses a Distance IR Bricklet to detect if the door of a server rack was opened. The Distance IR Bricklet is mounted inside the server rack and measures the distance towards the closed door. If the distance changes significantly then the door was opened.
To get a proper threshold the standard deviation of the distance measurements of the Distance IR Bricklets is calculated over a longer time. Martin Seener included a script for this task.
This check is the first one in a collection of Nagios checks for Tinkerforge.